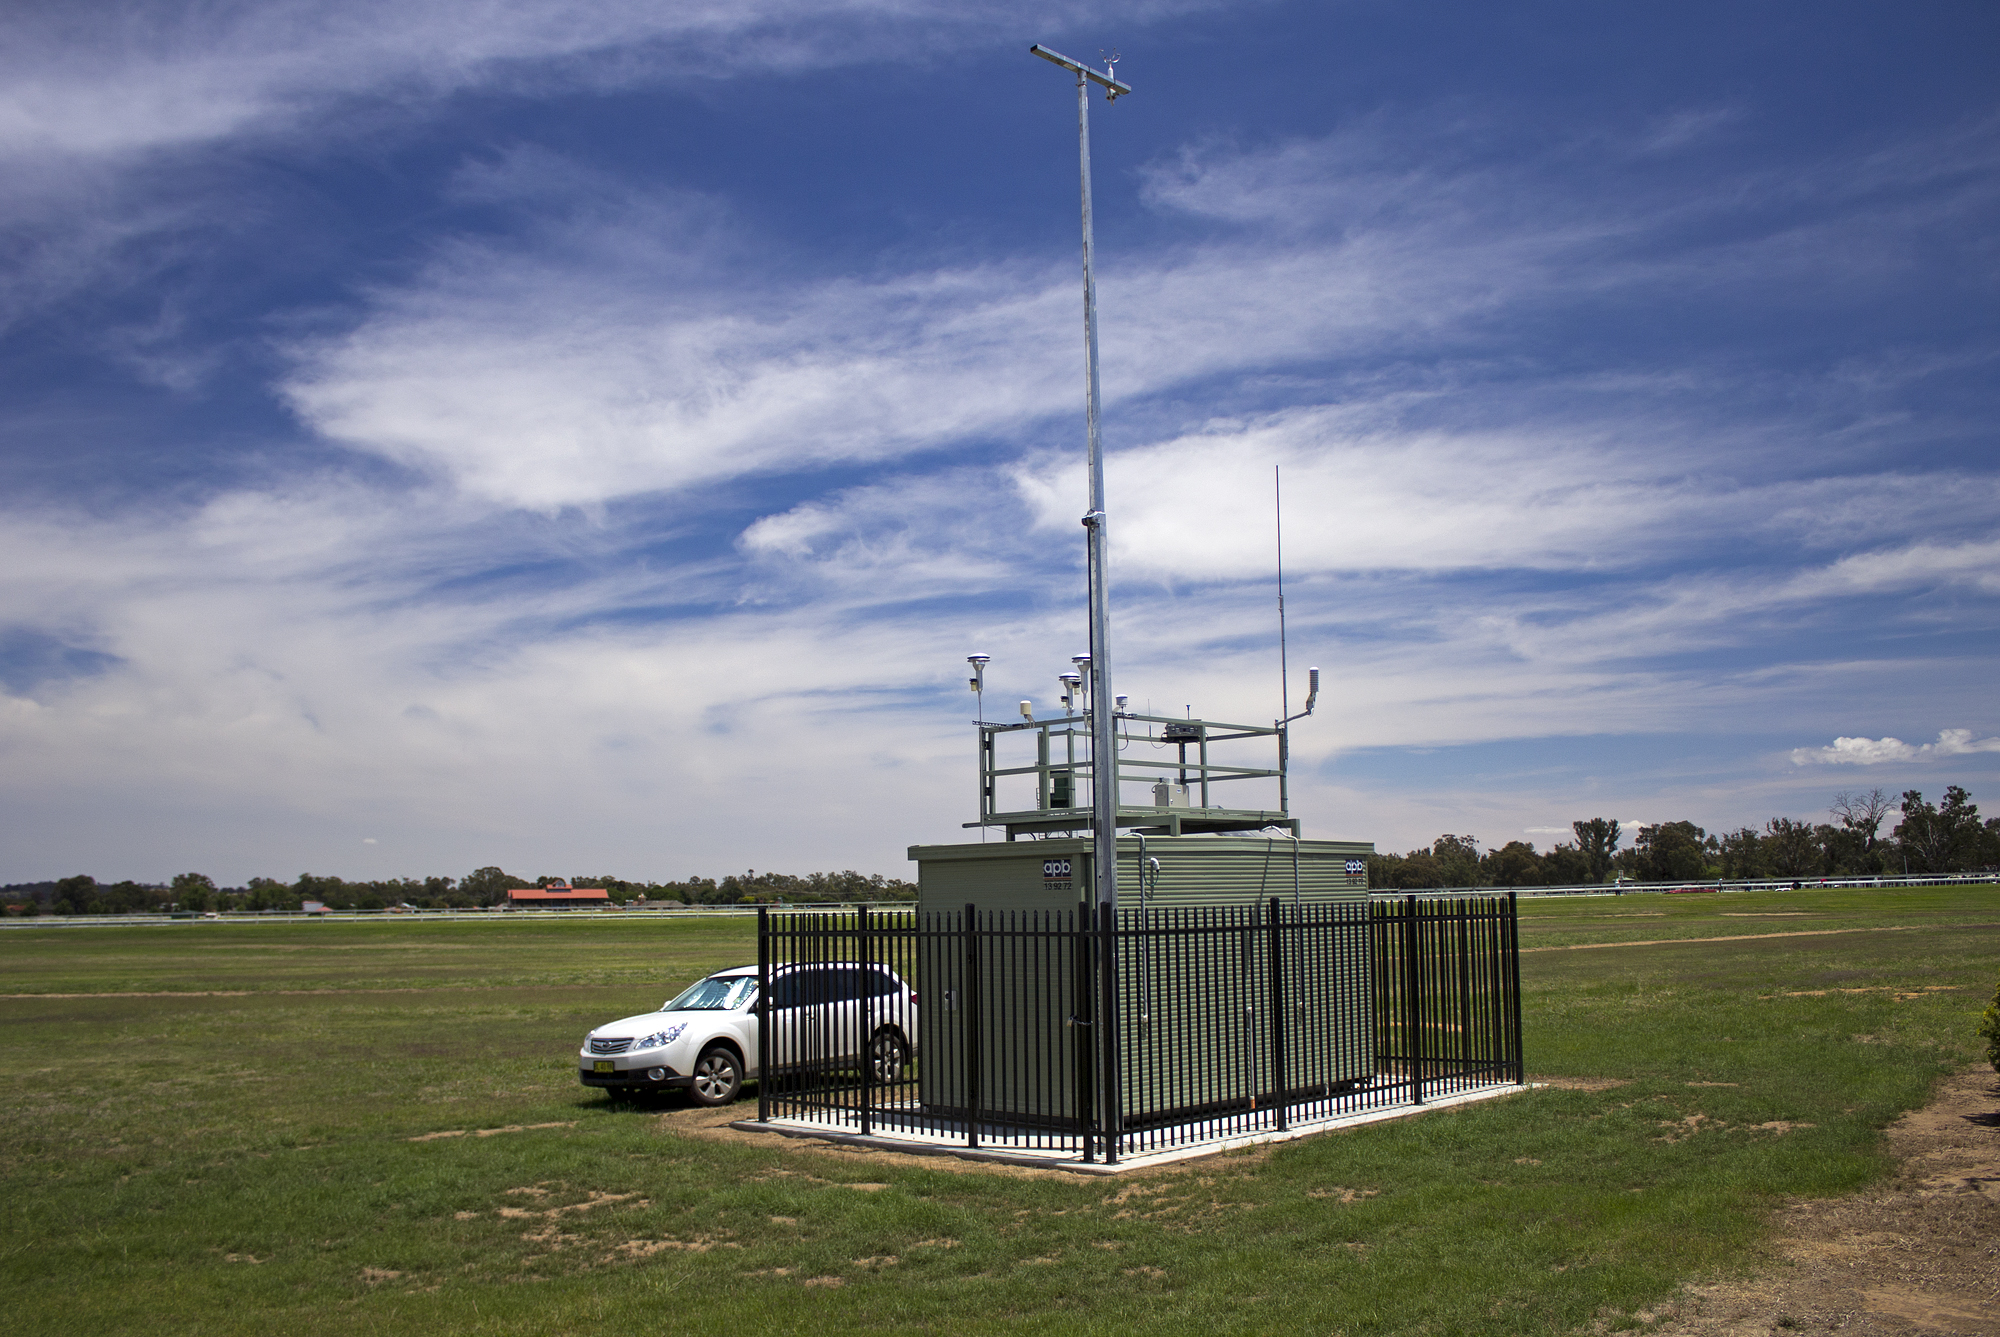
Air pollution monitoring stations remain badly short in number
This article was originally written in January 2016 on my old blog, mixture-art.net, and has been moved here. The writing style and information are unchanged from that time.
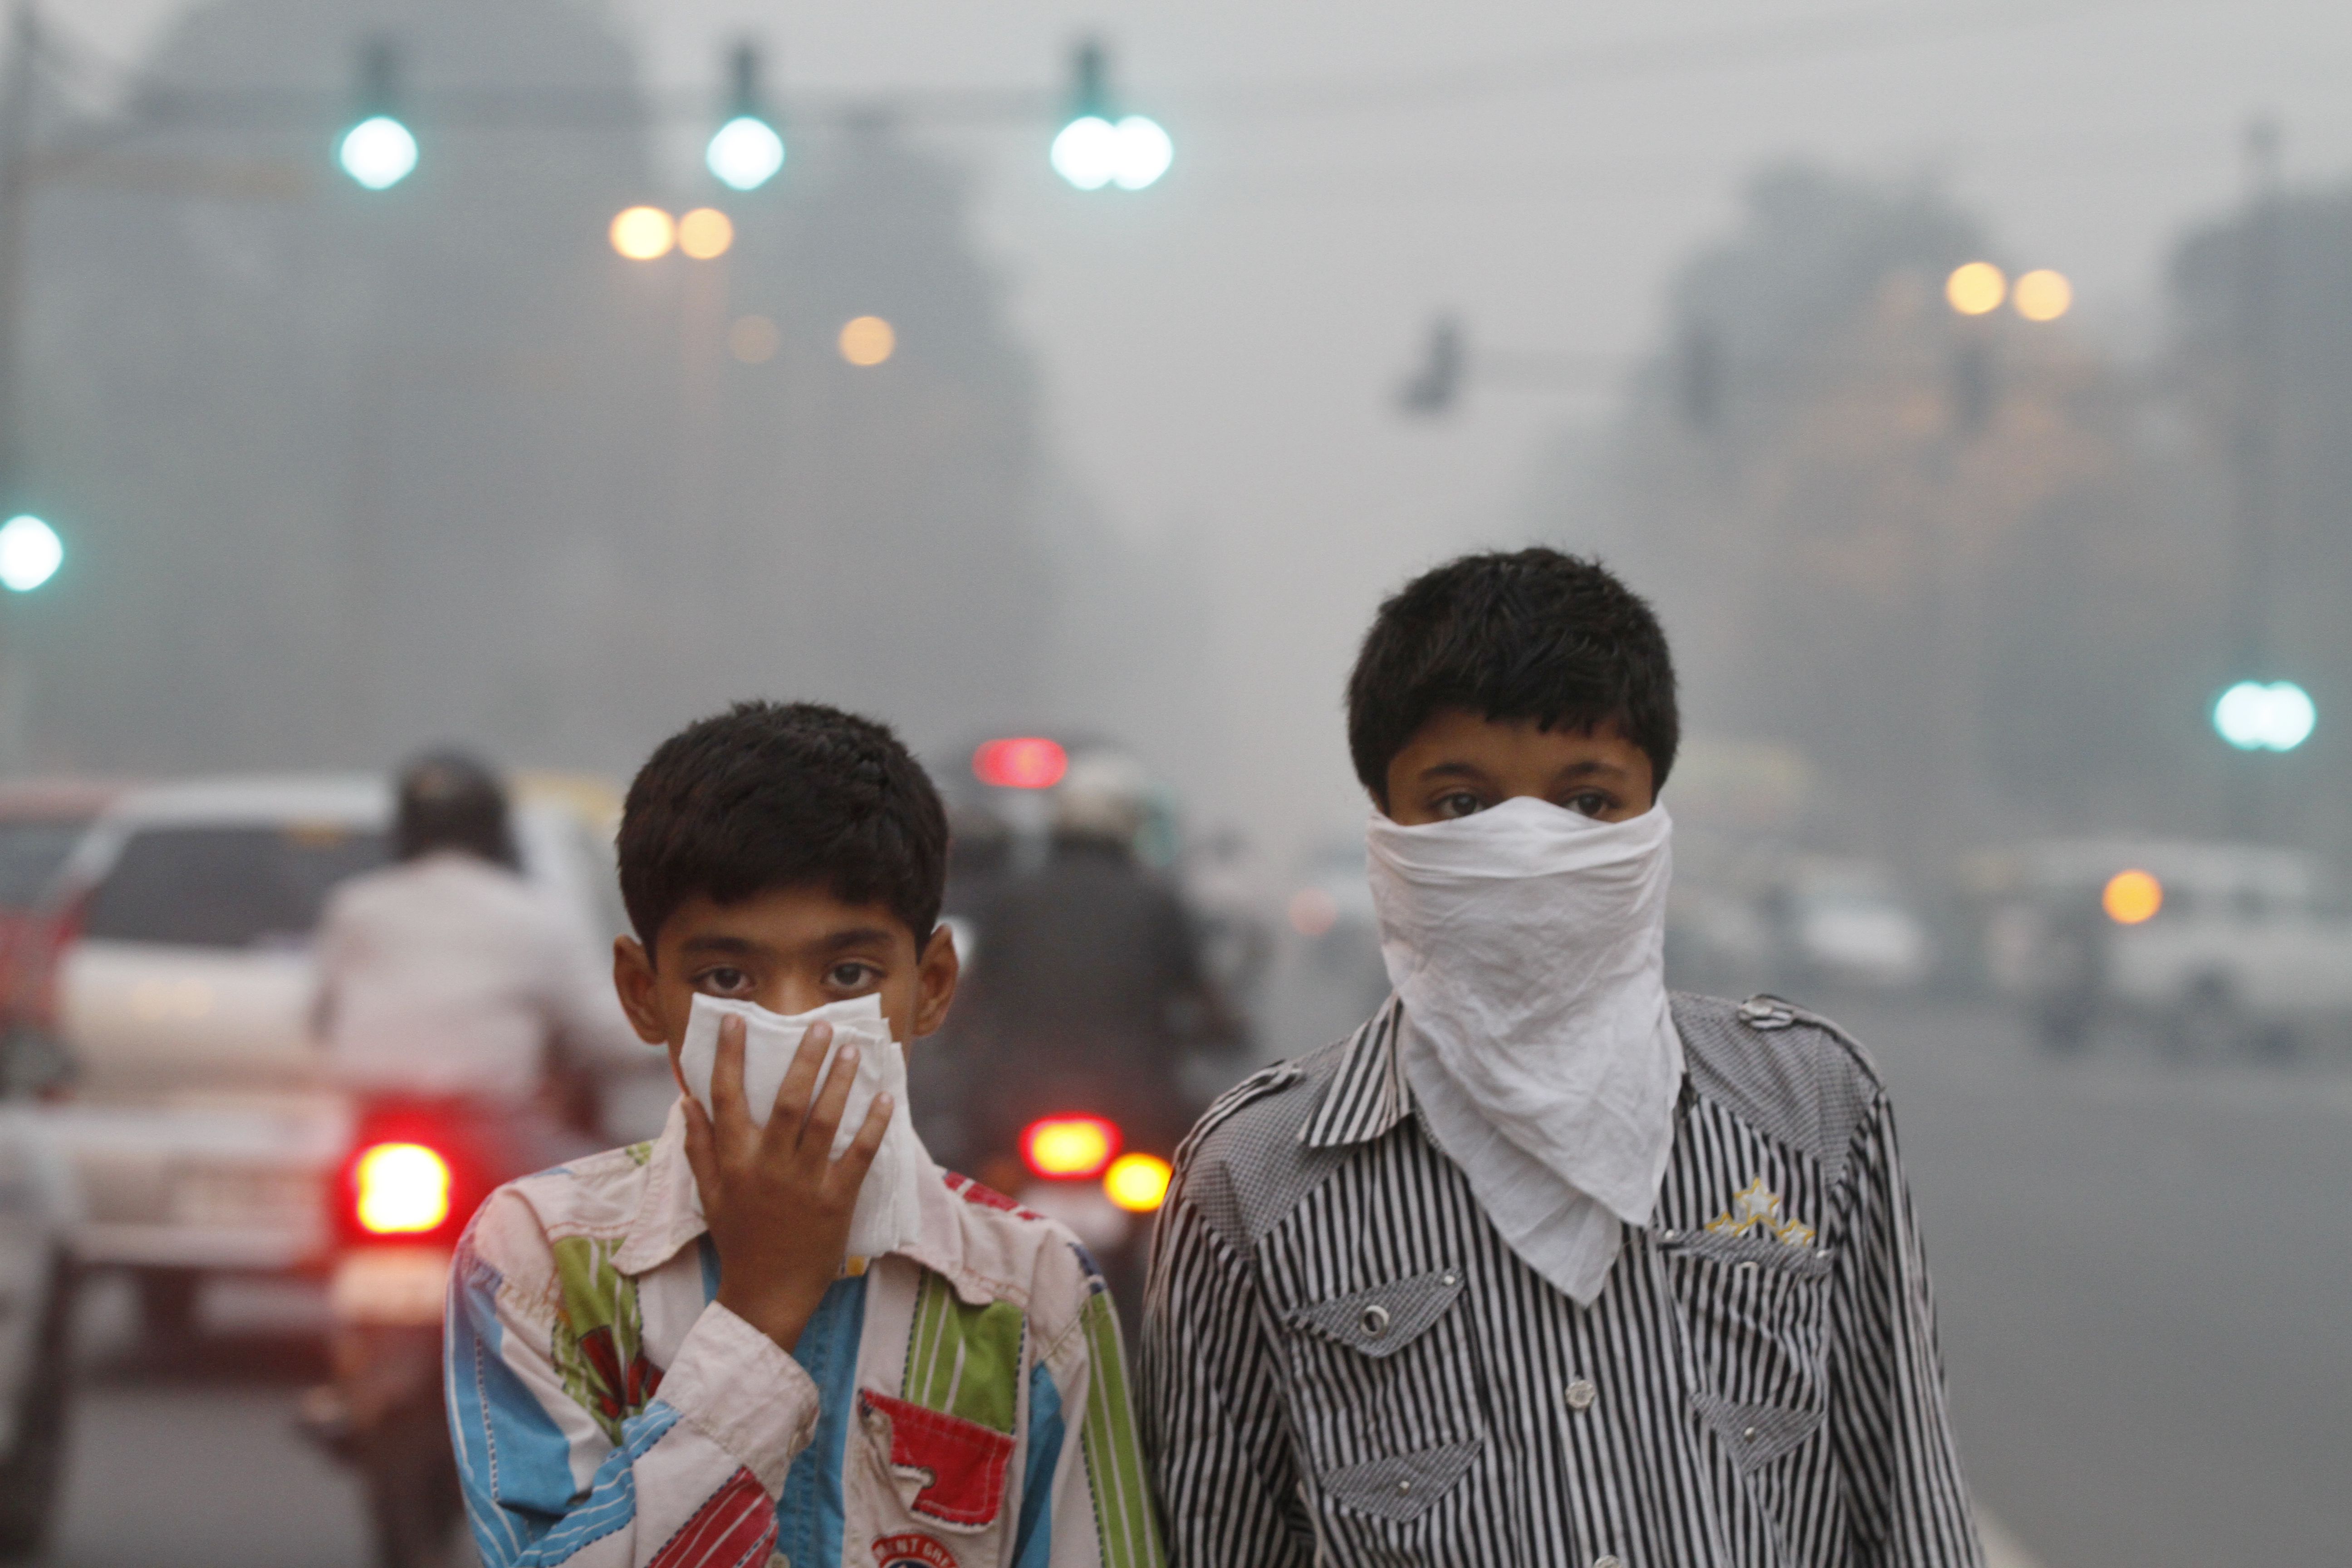
Air pollution is, needless to say, a problem worldwide.
A well-known example: in 2015 alone, Beijing, China issued red alerts twice. Smog in China closes schools and construction sites, cuts traffic in Beijing

School closures, indefinite halts to construction work, restrictions on which vehicles can drive: the government has scrambled to respond, but the underlying problem is that China’s limits on pollutant content in gasoline are far too lenient, and tightening them to match other countries would carry an enormous economic cost. No fundamental action can actually be taken as a result, which shows just how deep-rooted and intractable this problem really is.
In Delhi, India as well, many regulations were already introduced last year. The toll for vehicles entering central Delhi was set very high, at $11 (given that prices in Delhi are roughly a third of what they are in Japan, that amounts to the equivalent of a $37 toll!). India’s choked capital starts ‘pollution toll’ for trucks
London, UK and Singapore had already introduced traffic restrictions earlier.
The news that drew the most attention in 2015 was the forest fires in Indonesia. They caused serious air pollution as far away as Singapore, Malaysia, Thailand, and even Taiwan. Indonesia begins evacuation of infants from haze-affected regions Indonesian Fires Create “Hazardous” Levels of Air Pollution in Singapore


Less widely noticed is a region deep in the mountains of Tibet, where pollutants generated by brush burning at lower elevations tend to collect because of the terrain, causing serious damage to local crops. Countries like Albania face a different problem: exhaust pollution levels that refuse to fall because of an aging vehicle fleet.
In London, mentioned above, and in Grenoble, France, the terrain favors surface-based temperature inversions, an ionosphere-like lid that forms overhead. This too is said to trap pollutants and keep them from dispersing within the city.

We all live exposed to air pollution, to a greater or lesser degree. The only information we can rely on in this situation comes from the measurements of the monitoring stations operated by national and local governments.
There’s a very convenient site, for example, that aggregates measurements from official monitoring stations around the world. http://aqicn.org/

The origin of this site is kind of interesting: it’s run by the American embassy in China. What first drew serious attention to air pollution in Beijing, apparently, was a tweet by a staff member at the US embassy in China.
Here’s an article describing that background ↓ How the US Embassy Tweeted to Clear Beijing’s Air
As a result, the Chinese government is reported to have built 1,500 additional monitoring stations around Beijing in 2015.
Coming back to our own Japan: the map above, showing monitoring stations around Tokyo, suggests there are a lot of them. Compared to cities elsewhere in the world, I’d say Tokyo has more than most.
Japan really is wonderful.
And on one level, that’s fine.
Monitoring stations aren’t cheap, and the will and effort put into installing them deserve praise.
But even so,
I want to push this a little further, toward something more fundamental.
Generally speaking, the main source of air pollutants is said to be vehicle exhaust, especially from diesel vehicles. Of course the source varies subtly depending on the specific substance, and the ratios differ too. Some pollutants are human-caused, some are natural, and the ratio between them varies greatly by geography. What follows, then, is only a general statement.
Various studies have evaluated the impact of exhaust gas. In an experiment conducted in Switzerland, for example, researchers reported that the incidence of lung disease drops by 12% for every 100m a residence is located away from a main thoroughfare. Living near Main Streets and Respiratory Symptoms in Adults In other words, whether there’s a busy road nearby has a very large effect on how air pollution should be assessed.
A wonderfully sensitive friend of mine who cycles once told me: “When I ride down Aoyama-dori and get to Shibuya, my eyes start to itch.”
This actually makes a lot of sense. Pollutants have weight. Their specific gravity is generally higher than the average for air as a whole, so they tend to settle lower down relatively easily. Not everything follows this pattern, of course, since wind and convection stir things up, but as a general tendency, “flowing from high to low” holds true. As anyone familiar with Aoyama-dori knows, it slopes downward from the eastern side near Omotesando toward the west, toward Shibuya, a fairly steep descent. And Shibuya, true to the character “valley” in its name, sits in a valley. Heading past Shibuya toward Ikejiri-Ohashi, you then climb back up a similarly steep slope. In other words, there’s ample reason for pollutants to accumulate in the valley around Shibuya Station.
How noticeable pollutants like PM2.5, NOx, and SOx are when they get in your eyes varies by person, but in most cases what you feel is dryness from loss of moisture and corneal damage from physical impact. Either way, the symptom is roughly “itchy eyes.” In other words, itchy eyes are a sign that you’ve caught some pollutants.
I found this fascinating, so I checked the data from the official monitoring stations mentioned above. But, well…

It turns out that, looking across both Aoyama-dori and Roppongi-dori, the only monitoring station is a single point near Saigoyama Park, up past the top of Dogenzaka slope and even past the old Yamate-dori. Anyone familiar with the area knows this is elevated ground. So, following the logic above, elevated ground should tend to have relatively lower amounts of pollutants.
By the way, here’s what Saigoyama Park looks like (my old neighborhood) ↓
My question went unanswered…
My wonderful friend also said this:
“Around the Imperial Palace, the air is good despite the heavy traffic. But step one block toward Tokyo Station and the air suddenly gets bad, bad enough that you can actually see something in the air blocking the light.”

This too is interesting.
Many air pollutants are water-soluble or can easily be washed away with water. SOx, for instance, floats around in the atmosphere in an ionized state due to ultraviolet light, and when it combines with OH ions it apparently forms sulfuric acid (H2SO4) or sulfurous acid (H2SO3).
Which means the moat might actually be an effective machine for collecting air pollutants. On the opposite side of the moat, toward Tokyo Station, tall buildings line the streets, and airflow there is naturally poor. Pollutants that unluckily drift to that side, blocked by the buildings and unable to disperse, may end up staying put, stirred up by passersby and vehicles, then settling again, perhaps repeating this cycle day after day in a cramped area. (A bit sad, really.)
Now, as most would expect,

Forget Tokyo Station, forget the moat: this data is useless for any comparison at all.
Is this the limit of official monitoring stations? Yet most of the data researchers around the world use is said to come from official monitoring stations, precisely because collecting your own data independently is extremely costly.
So does that mean fine-grained, detailed data simply doesn’t exist anywhere in the world? Not necessarily. (There’s hope?!)
In the field of radiation, for example, there’s an excellent platform called Safecast. It’s a project launched by Joi Ito, director of the MIT Media Lab, in the aftermath of the Tohoku earthquake. Volunteers buy a unit like this ($500)
and take measurements on their own initiative, uploading the data to the database. For a project of this kind, it has shown remarkable continuity, and it’s a rare case where data is still being updated to this day.
But look closely at the details of the data, and you can’t help but have doubts about its credibility. The measurement date and time, for example, is effectively “self-reported.” So if you access the database, you can find mysterious entries dated, say, January 1, 2028. That’s obviously an error you can spot. But flip that around, and it means that even the data labeled as “today’s measurement” could actually be from any date at all.
This is probably the limit of what volunteer effort can achieve. Without obligation, there’s no accountability. Recent versions seem to be manageable via a smartphone connection, so I have hopes for improvement, but as long as it still depends on volunteers, this kind of reliability problem won’t go away.
The exact same thing can be said of Air Casting. This database also has plenty of data volume, but it lumps data together under labels like “data from people using the MQ-131.” The MQ-131 is a gas sensor for measuring ozone, but as anyone who’s dabbled even a little with sensors knows, “how do you suppress error?” and “how do you calibrate it?” are areas that demand a great deal of know-how, skill, and effort: managing supply voltage, temperature compensation, airflow control, vibration, and so on. Lump together data from someone who manages and designs all of that rigorously with data from someone who doesn’t, and in the end you have no idea what’s actually happening. Data like that has no value. To put it even more bluntly, sensors of this type, which rely on heat generated by a chemical reaction and the resulting change in resistance, usually have an adjustment-use variable resistor built in. Give that variable resistor a little twist, and the value drifts immediately. Separating the data is of course possible: you could split it apart by tying it to usernames or equipment IDs. But then the data volume becomes far too small to be useful.

I can’t help but feel a real sense of imbalance here.
On one hand, we have solid official values, but with low geographic resolution: in the end, we can’t know the value for “right here, right now.”
On the other hand, we have finely detailed data: but the update frequency isn’t guaranteed, and the reliability of the data itself is questionable.
Is there really no way for us to get information that’s both truly trustworthy and available on demand, about the conditions right around us?
The project born out of this worry and struggle of mine is the one below. If you’re interested, please get in touch; contact details are on the last page of the slideshare below.
VasP: An Environmental Data Collection Project Using Commercial Vehicles from Yuichiro Kuzuryu (Kuz)
Originally published in Japanese at https://clazytech.com/2016/01/1993/. Translated with LLM assistance and reviewed before publication.